


Hello everyone! Today I'll be sharing what I've built for Hashnode's Vercel Hackathon and how I've built it. Ok, so without further ado, let's get started!
Inspiration
Have you ever wondered how you spend your time on your computer and how your productivity sessions look like? Well, I definitely did and so I decided to research about some desktop time trackers and found this. Unfortunately, arbtt doesn't provide any kind of UI for you to be able to see your stats the way you want it to. Therefore, I decided to create a viewer for it, and that is how Dev Insights was born!
What is Dev Insights?
Dev Insights is a desktop time tracker viewer supplementing arbtt - a time tracker that you install on your desktop to collect data about your desktop usage. Unfortunately, this means that you'll need to first collect data before Dev Insights is ready to be used. Of course, for illustration purposes, I'll be using my data that I've been collecting since December 2020.
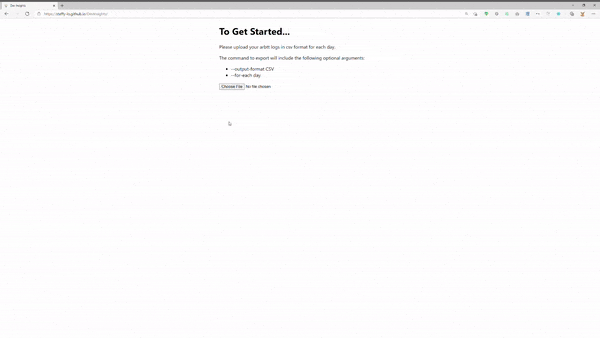
How you use Dev Insights is easy: simply upload your daily arbtt logs in CSV format and discover some interesting data about yourself!
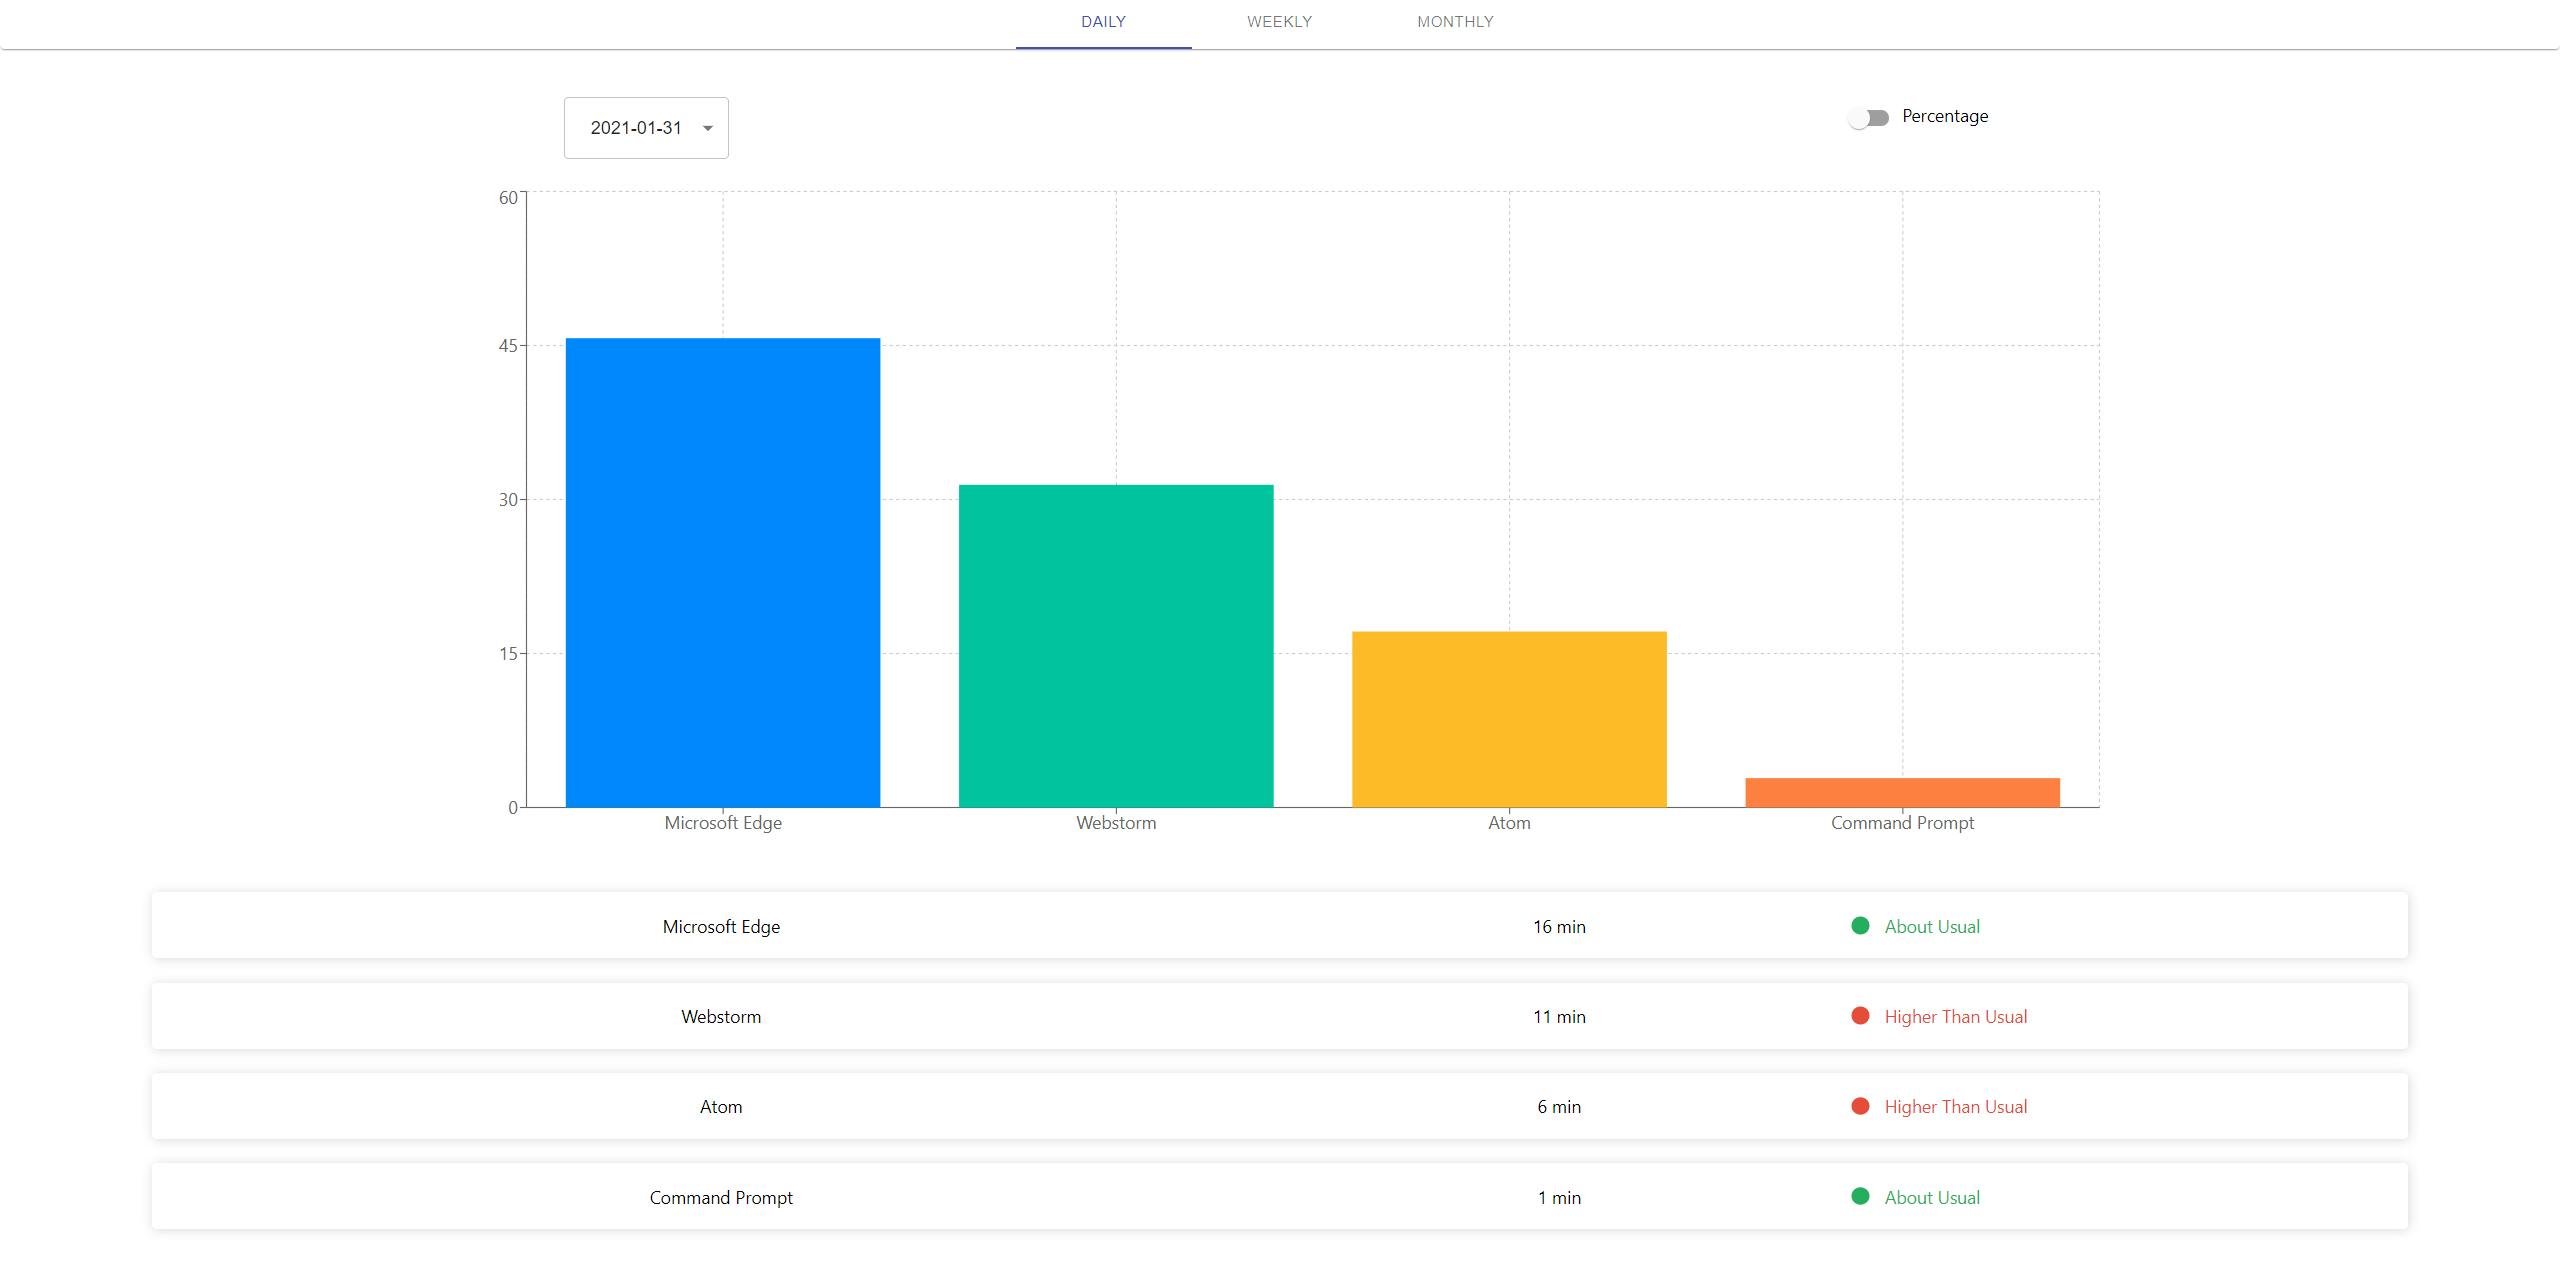
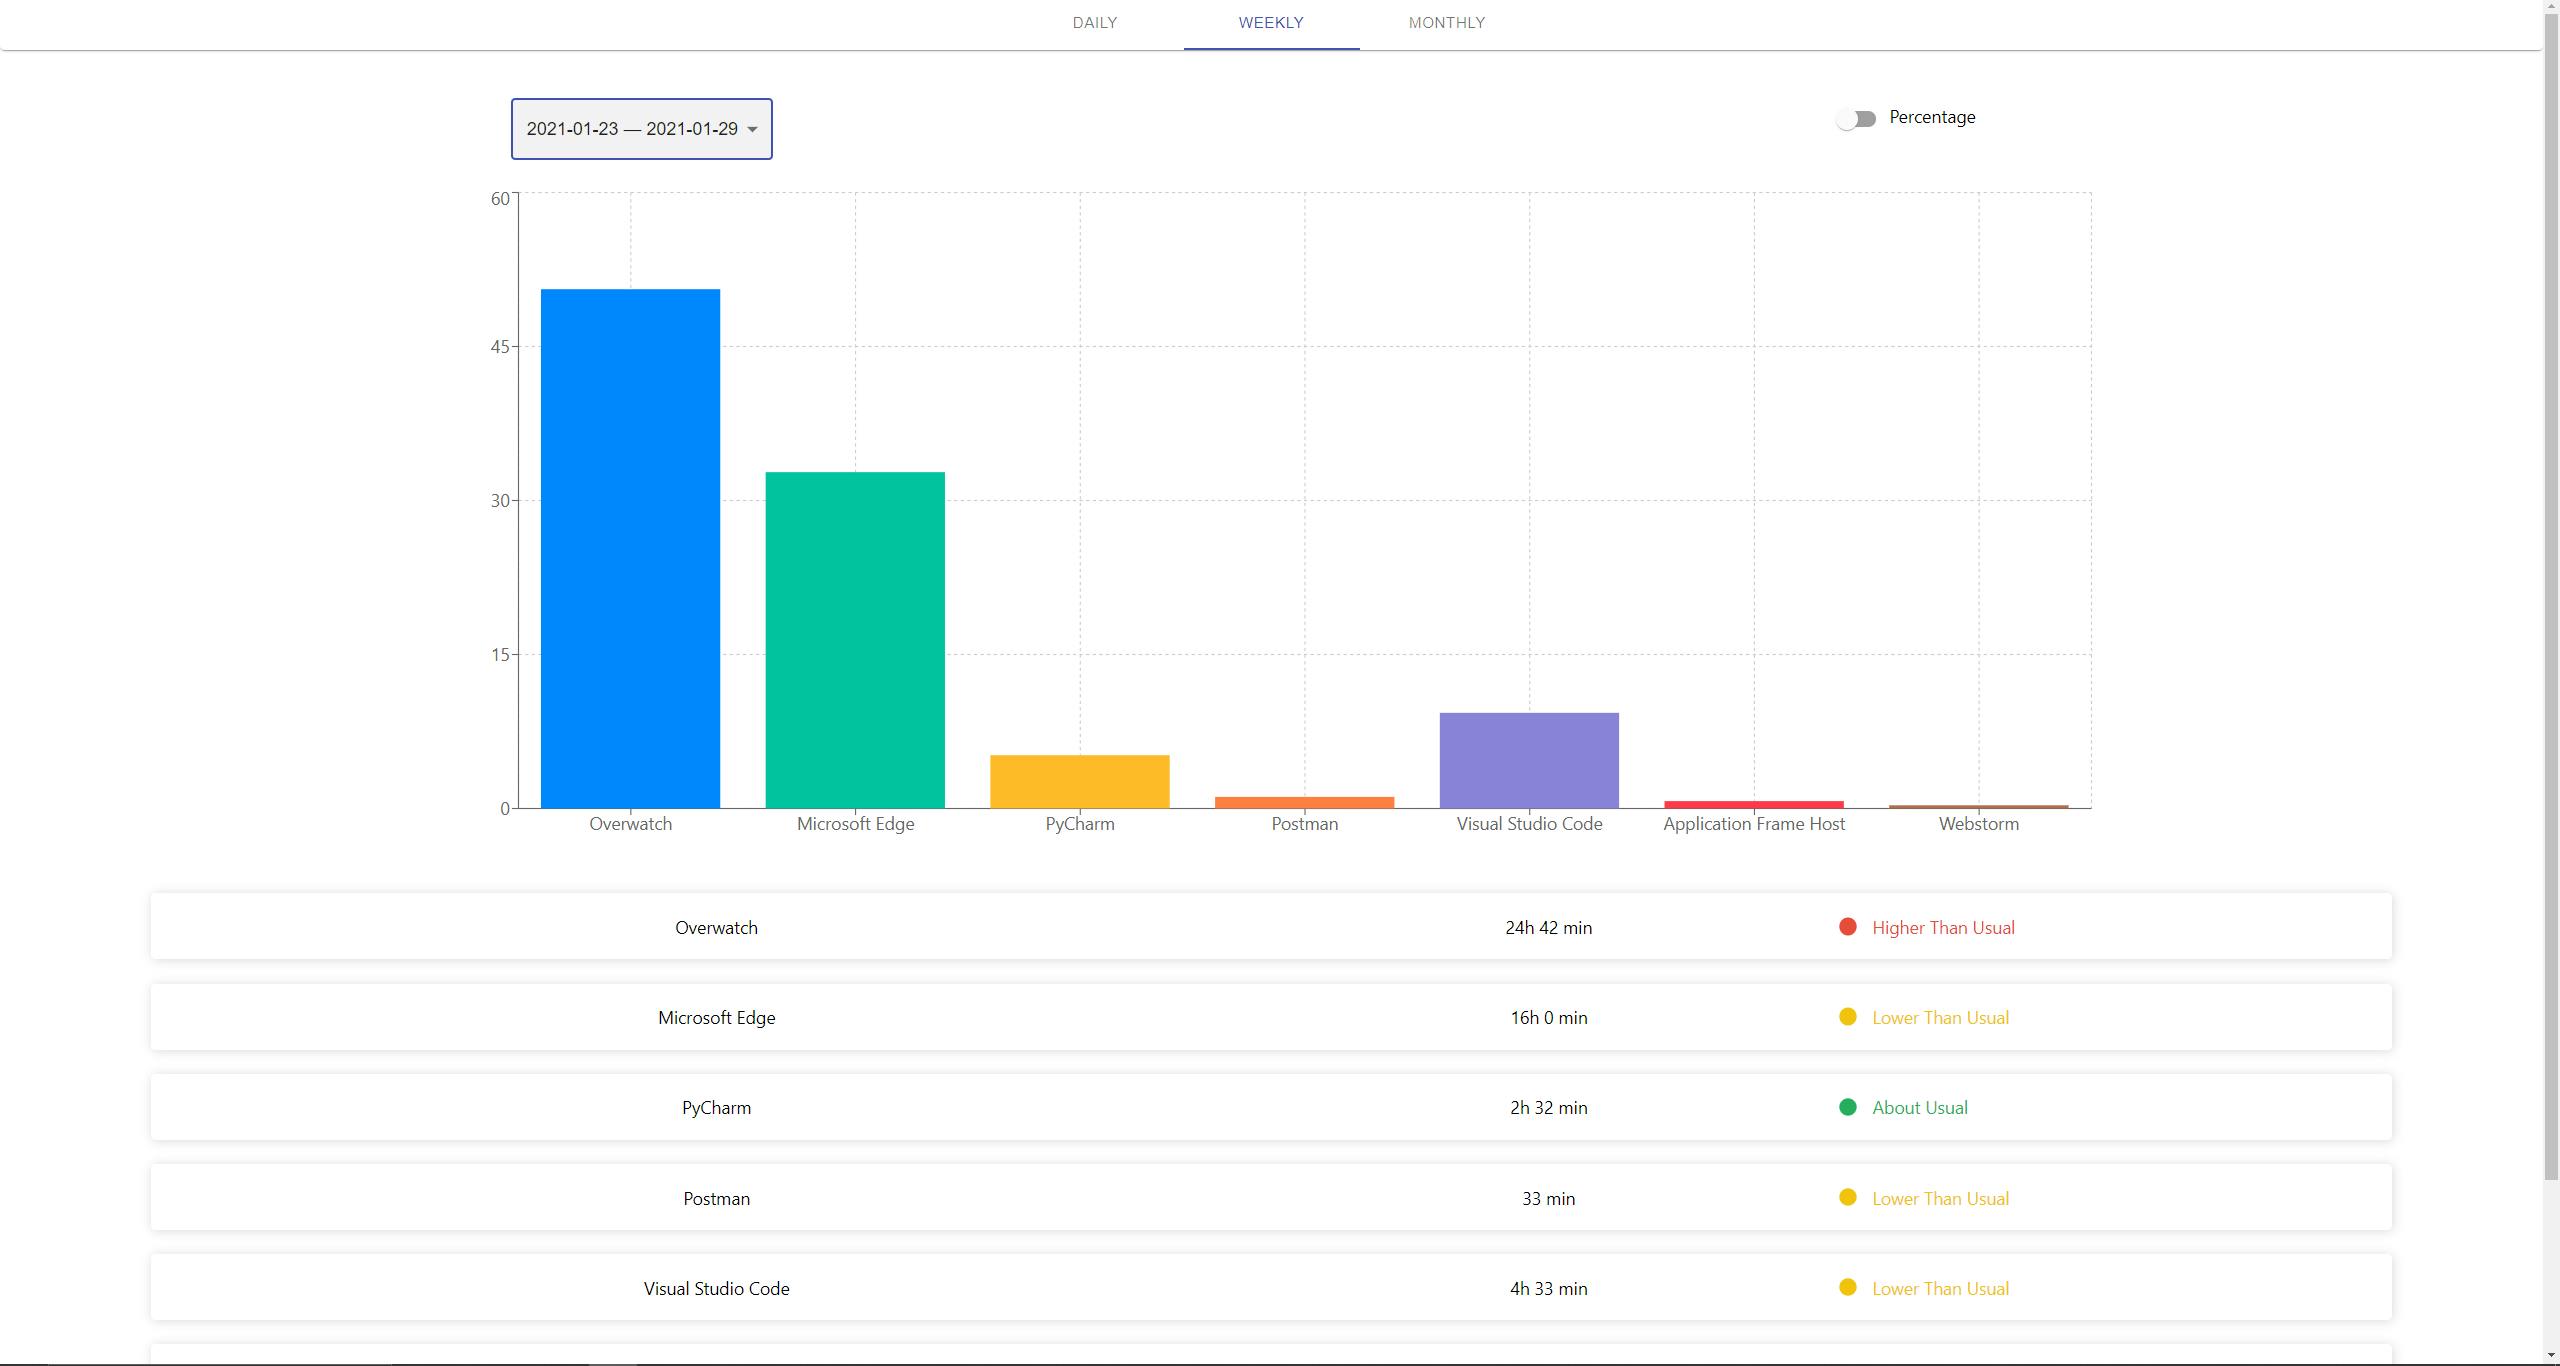
So how does Dev Insights help? It can help you view your typical desktop usage in a given day or week in addition to your overall desktop time usage in a given day, week, and/or month.
Daily View
Weekly View
Monthly View
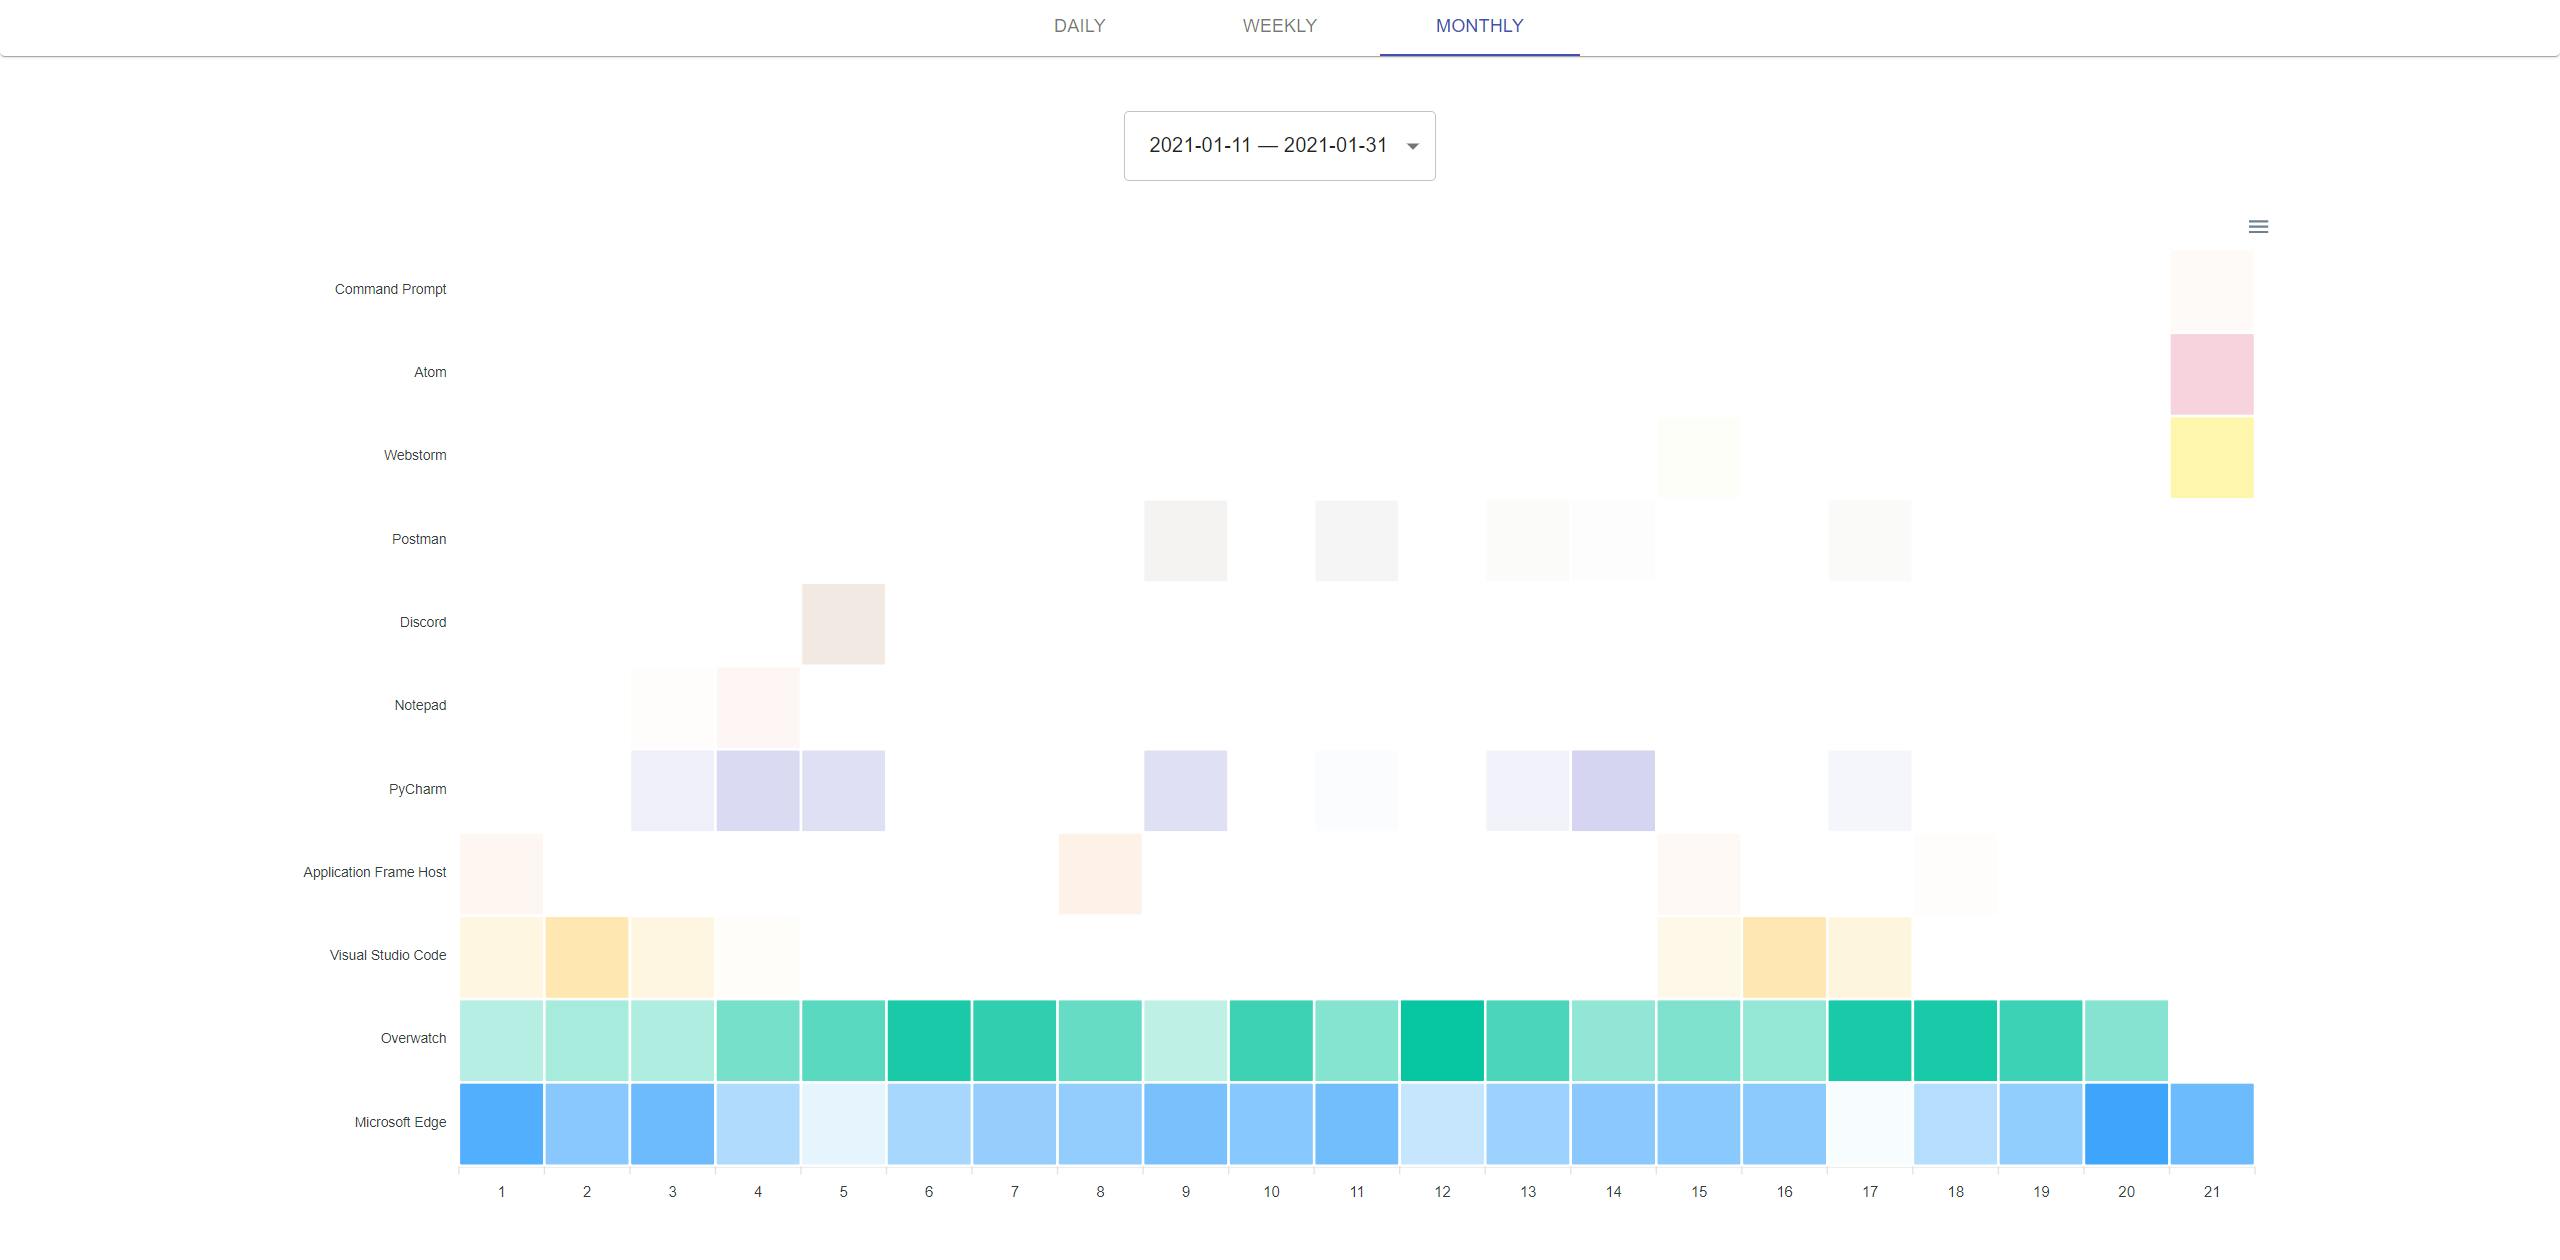
This can mean realizing your increase/decrease in activity for the past week, fixing your bad habits of procrastination, or spending too much/too little time on something that you might look to reduce/increase it.
From my personal results, I can see that I spend a lot of time gaming compared to my productivity sessions and so I should look to decrease it. Then again, this data was taken from my gaming desktop and since I've been working mostly from my laptop nowadays, this makes sense... Ok I know what you're thinking, that I'm making excuses for myself. Fine, I'll acknowledge it - I am low key addicted to Overwatch right now. But hey, at least I made time to participate in this hackathon!
How I Built It
Dev Insights was built using React (my favourite JS framework!), and some charting libraries including Recharts and ApexCharts.
Obviously, the first step of the build process was to process the arbtt logs. This was made easy thanks to a library called react-csv-reader which basically lets you handle the csv file after it has been converted into a JSON.
import React, {useState } from "react";
import CSVReader from 'react-csv-reader';

function App() {
    return (
         <CSVReader
              parserOptions={{ header: true }}
              onFileLoaded={data => {
                  console.log(data)
              }}/>
    );
}

export default App;
After that, it's just a matter of manipulating the data to make it work with the charting libraries. I would say this was the most difficult and challenging part of the project, nevertheless the most rewarding.
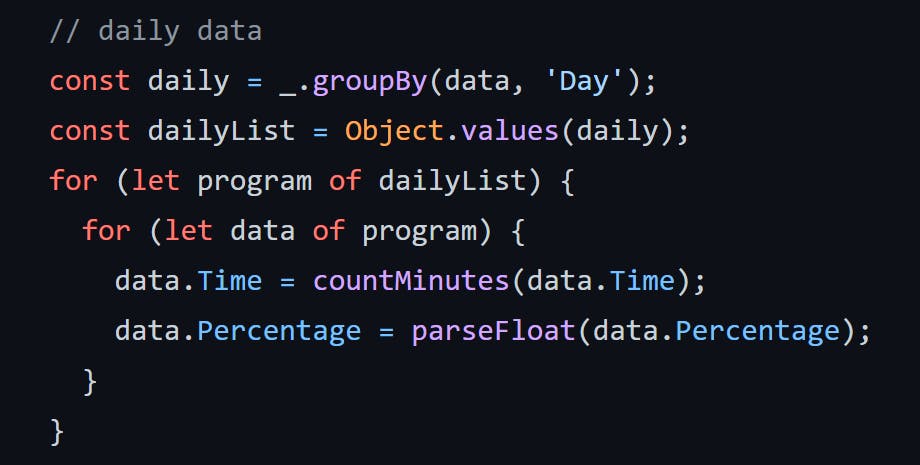
Daily data was the simplest as our exported arbtt csv data logs per day. With the help of the lodash library, I was able to group the raw data by days and simply extract the percentage and time in minutes for each distinct program usage.
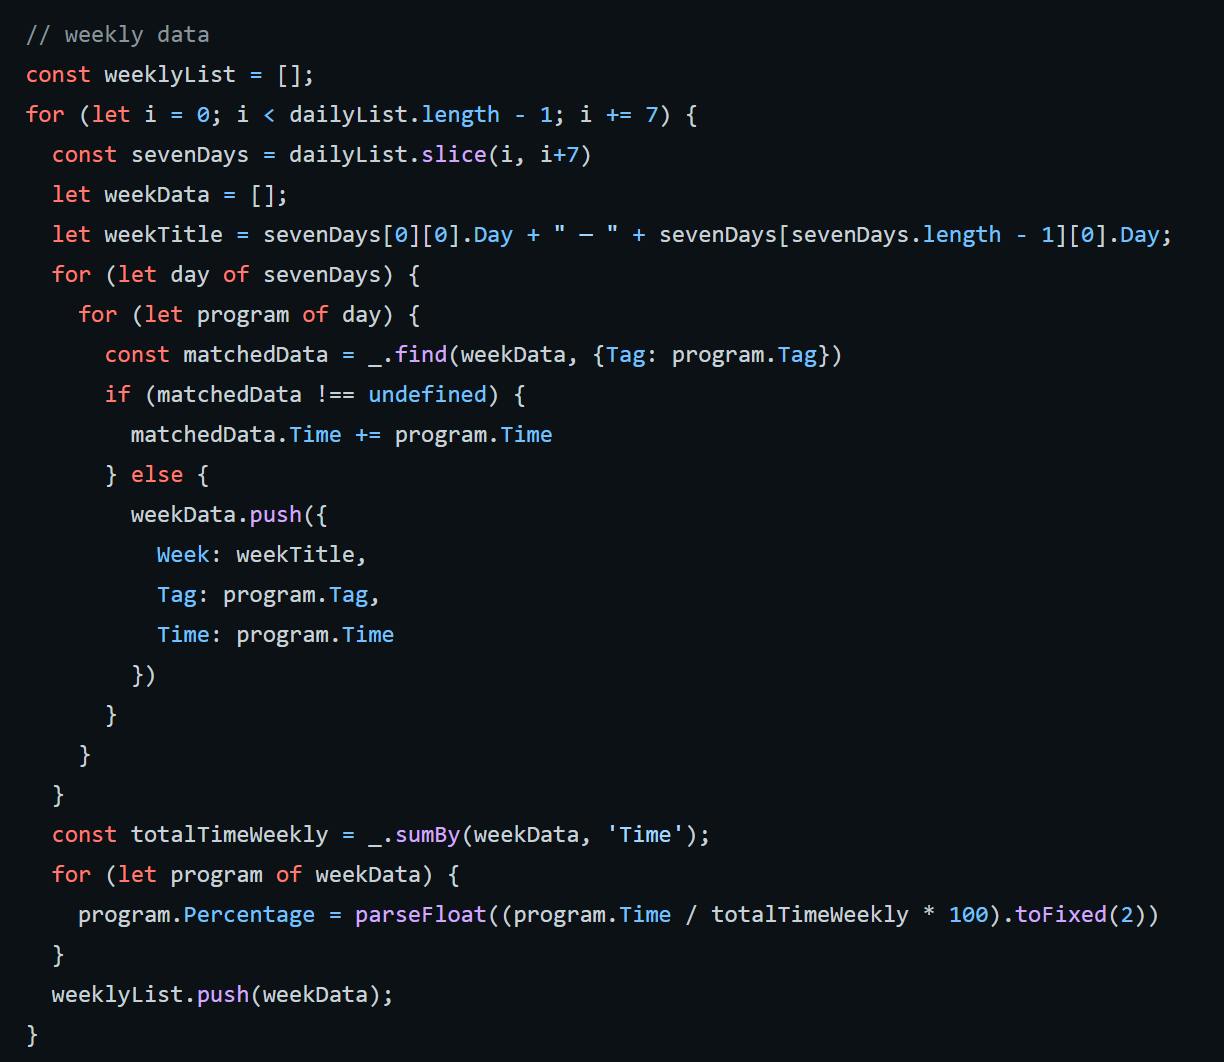
Next up is weekly data, which is a little trickier as we need to aggregate our daily records in time and percentage. To do this, I first loop the daily list over 7 days to get a list of 7 daily data, and loop over this list to sum up the time taken in total for the week. Then to calculate the percentage use for the week is as simple as taking time taken for the program divided by the total time taken for all programs. Sounds simple enough? Well, the exact implementation is fairly more verbose.
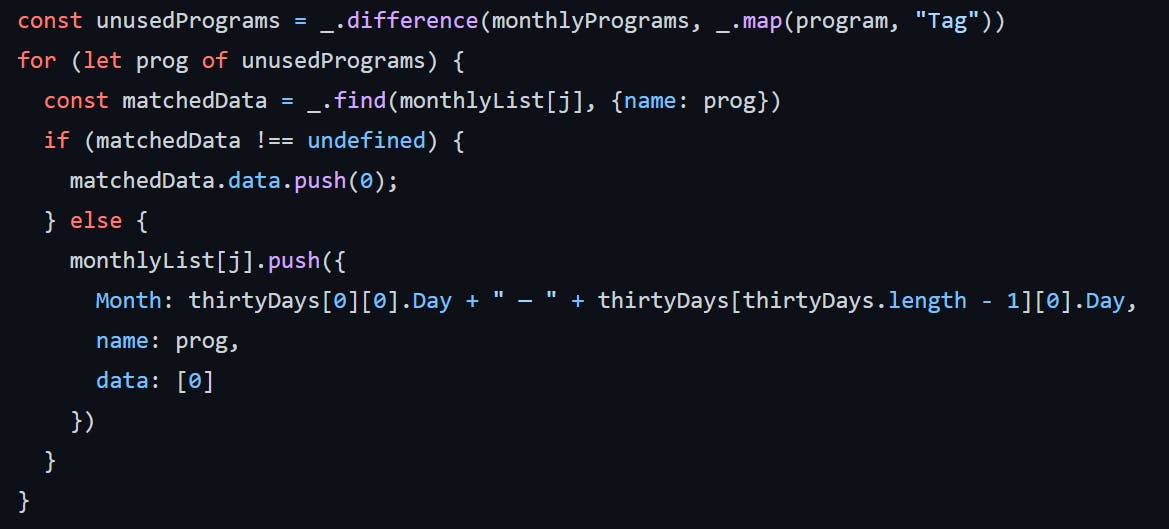
Finally, the monthly data is the trickiest. While the initial setup is similar to the weekly data (i.e., looping over 30 days instead of 7 days), because I've chosen a heatmap to visualize this information, we need to take into account the days where programs went unused and assigning them a time and percentage of 0. Again, with the help of lodash, I was able to easily extract the list of unused programs for the month and push zero data onto the monthly list.
Last but not least of them all is the styling to make the visualizations more pleasing to look at. For this, I used Material UI. Highly recommend it if you're looking for a quick, good-looking front-end, or if you're simply not really a front-end type of person like me haha.

Challenges
The biggest challenge that I ran into was definitely the data manipulation to make it work with the charting libraries and also a little bit of time constraint due to deciding to take part in this hackathon quite late. My initial plan for the data visualization for Dev Insights was definitely more complex, integrating multiple charts. However, due to the time constraint, I've decided to make do with simpler visualizations that is nonetheless still insightful.
Next Steps
In the coming weeks after my well-deserved break from my hackathon marathon, I'll look to integrate more complex charting and activity tags for Dev Insights to extract even more insightful data so stay tuned!
Feel free to try out Dev Insights with your own data here deployed through Vercel and as always, thanks for reading!
P.S. Repo can be found here where I give brief instructions on how you can set up your arbtt to work with Dev Insights