


So I decided to build a desktop time tracker using arbtt, the automatic, rule-based time tracker to start collecting some statistics about myself and how I spend my time.
The motivation behind this project was actually me simply wanting to use this cool Recharts library but realized that collecting insightful data about myself became the bigger reason. Because of this, I'm thinking of expanding this project in the future to log my web activities as well and perhaps make a separate article for it, but for now, it's just desktop programs.
Without furtherado, let's get started.
Installing arbtt
First, we'll need to install arbtt. arbtt provides an easy way for you to collect data on time spent on your desktop and should automatically run in the background after installation.
By default, the program captures your activity per minute, but it's possible to change this settings by passing --sample-rate RATE to arbtt-capture, where RATE specifies the sample rate in seconds.
Example: to set per hour instead
arbtt-capture --sample-rate 3600
Let arbtt run for a day or so, and then check your stats by running arbtt-stats on your terminal. The default output for the Tag will not look very pretty, but you can change that by creating a configuration file. Name it anything you like and place it in the current directory your terminal is in, then create aliases that will map the default Tag to a more human-friendly one.
For example:
aliases (
    "Program:_Device_HarddiskVolume5_Windows_explorer_exe"    - > "Windows Explorer",
)
Finally, run the following command to see changes to your output.
arbtt-stats --categorizefile FILENAME
Now, we want to be able to parse this data to feed into Recharts. Fortunately, arbtt-stats accepts output format as an argument that may be one of: text, csv (comma-separated values), or tsv (TAB-separated values), where the default format is text.
The output format here that I chose is CSV which will then be redirected to a file called arbttlog.csv
arbtt-stats --categorizefile FILENAME --output-format csv > arbttlog.csv
By default, arbtt-stats will report to you, total time spent in each program cumulative, but if you want to report per some period, you can pass --for-each PERIOD, where PERIOD can be be minute, hour, day, month or year. There are also many more options you can tinker around. Check out the documentations in the ~/arbtt/doc directory for more information.
Setting Up the Backend
Here I've built a simple function in Python to parse the CSV data into a list of dictionaries, which will then be sent to the client as a JSON when a request is made.
def parse_data():
    parsed_data = []
    filename = "arbttlog.csv"
    with open(filename, 'r') as data:
        header = []
        i = 0
        for line in csv.reader(data):
            if i == 0:
                # parse header
                header = line
            else:
                row = {}
                for i in range(len(header)):
                    row[header[i]] = line[i]
                parsed_data.append(row)
            i += 1
    return parsed_data
The data structure of parsed_data should look something like:
[
    {
       'Tag': 'tag1',
       'Time': 'time1',
       'Percentage': 'percentage1'
    },
    {
       'Tag': 'tag2',
       'Time': 'time2',
       'Percentage': 'percentage2'
    },
    ...
]
Setting up React and Recharts
Using the create-react-app command, we should be able to quickly get a working React App up and running, and simply make the following changes to App.js.
// App.js
import React, {useState, useEffect} from "react";
import { AreaChart, XAxis, YAxis, CartesianGrid, Tooltip, Area } from 'recharts';
import './App.css';
import {getUsageData} from "./actions";

function App() {

  const [data, setData] = useState([]);
  useEffect(() => {
    getUsageData() // fetch parsed_data from backend
        .then(data => {
            let cleanData = data.filter(d => !d.Tag.includes("unmatched") && !d.Tag.includes('omitted'));
            cleanData.forEach(d => d.Percentage = Math.ceil(d.Percentage));
            setData(cleanData);
        })
  }, []);

  return (
    <div className="App" style={{ marginTop: '5%' }}>
        <AreaChart style={{ margin: 'auto' }}
                   width={1500} height={550} data={data}
                   margin={{ top: 10, right: 30, left: 30, bottom: 0 }}>
            <XAxis dataKey="Tag" />
            <YAxis />
            <CartesianGrid strokeDasharray="1 1" />
            <Tooltip />
            <Area type="monotone" dataKey="Percentage" stroke="#8884d8" fillOpacity={1} fill="#8884d8" />
        </AreaChart>
    </div>
  );
}

export default App;
Of course, don't forget to install Recharts.
npm install recharts
In the above code, I'd like to bring attention to how I cleaned up the data by turning the percentages into integers. This is because ReCharts can't plot the data well with float data types for some reason. I believe it lies with how the library calculates the cut points of the Y-axis but I'm happy enough with the result to work with integers.
Using Recharts is quite straightforward. Simply pass to the data props a list of JSON representing your data points, specify the dataKey in the XAxis component, in our case: Tag, and finally the dataKey to plot the Area with, in our case: Percentage.
And the result would look something like this:
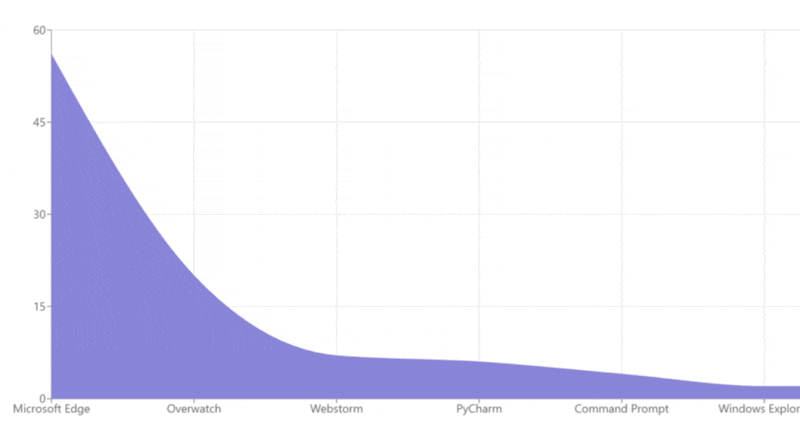
Breakdown in % of my Desktop Usage in a Day
Obviously, this is a very simple example that can be greatly improved by plotting with different charts Recharts provide and enabling filtering options such as viewing by program, by different days, etc.
Hopefully, this article has been useful, informative, and an interesting side project that you might consider taking up. Thanks for reading!
P.S. Feel free to look at my implementation at github.com/steffy-lo/Desktop-Time-Tracker